EN|UA
Trick or Treatment
ExplainerEvidence Files

Genetics: What Your Genes Really Decide, and What They Don't

Same genes, different lives: Pima Indians in Arizona have type 2 diabetes at a rate of 38%, while their genetic relatives in the mountains of Mexico have it at 6.9%. Height in men is 87–93% heritable, yet South Korean women grew 20 centimetres taller in a single century. This explainer is about where genes really decide, where they only shift the odds, and why “it runs in the family” almost never means “nothing can be done”.

34 min read44 sources

Three numbers to start with

Each comes from a separate study, linked in the text and at the end. Together they make the main point: genes matter a lot, just not in the way we usually think.

49%

average heritability across 17,804 human traits in fifty years of twin studies. Roughly half and half: genes and everything else

Polderman et al., Nature Genetics, 2015

+20 cm

how much taller South Korean women became in a century. And height is one of the most heritable traits ever measured

NCD Risk Factor Collaboration, eLife, 2016

46%

fewer heart attacks and other serious coronary events in people with the worst genetic risk who didn't smoke, weren't obese, exercised and ate well. Compared with people with the same genes but without those habits

Khera et al., NEJM, 2016

Why “it runs in the family” sounds like a sentence

Everyone on your mother's side is overweight. Your father and grandfather both had heart attacks before sixty. Your grandmother had breast cancer. Most of us carry a family list like this in our heads, and it feels like a forecast: if they had it, I will too.

Partly, that's true. Genes influence almost everything that can be measured in a person, from height to the tendency to become depressed. But families share more than genes. They share a kitchen, habits, income, a neighbourhood, attitudes to doctors and to cigarettes. Separating one from the other takes special kinds of studies: of twins, of adopted children, of millions of genomes.

This explainer is about those studies. First, what the word “heritability” really means, because without that every percentage is misleading. Then diseases, weight, height, intelligence, mental health and longevity. And finally, when a genetic test is genuinely useful and when it is money down the drain.

What heritability is, and why 80% doesn't mean “80% genetic”

Almost every conversation about genes rests on one number: heritability. And it is almost always misunderstood. As a review in Nature Reviews Genetics explains, heritability is a population parameter: the share of the differences between people in a particular group that is linked to differences in their genes. The authors note that the concept has been surrounded by misunderstandings for a century.

It is mostly measured in twins. Identical twins share almost all their genes, non-identical twins about half. If identical twins resemble each other much more than non-identical ones, the difference is put down to genes. A 2015 meta-analysis pooled nearly every such study from half a century: 2,748 publications, 17,804 traits, more than 14.5 million twin pairs (some counted in more than one study). Average heritability came out at 49%. The surprise was elsewhere: for most traits (69%), twin resemblance was explained by genes alone, with no noticeable contribution from the shared family environment. Growing up in the same home makes siblings less alike than most people assume.

Three things to know about heritability

Without them, every percentage, including the ones in the chart below, is misleading.

01

It describes a group, not you

Saying “my height is 90% genetic” makes as little sense as saying “the area of a rectangle is 90% due to its length”. Heritability describes why people differ from one another, not what a particular person is made of.

02

It depends on conditions

When everyone lives in roughly the same conditions, the differences left between people are mostly genetic, and the number goes up. When conditions vary a lot, it goes down. Intelligence, below, shows this directly.

03

Heritable doesn't mean fixed

High heritability doesn't stop a trait from changing. The best proof: height in men is about 90% heritable, yet South Korean women grew 20 centimetres taller in a century.

One sentence worth remembering

The key point

Heritability of 80% does not mean that 80% of a trait in you comes from your genes. It means that in a particular group of people, under particular conditions, 80% of the differences between them are linked to differences in their genes. Change the conditions, and the number changes.

Three ways genes affect health

“Genetic” describes very different situations. Which of the three yours falls into decides what you can do about it.

01

One gene almost decides

A single change in a single gene causes the disease almost for certain. Example: Huntington's disease, an inherited brain disorder that gradually takes away control over movement, thinking and behaviour. Each such disease is rare on its own. This is where a genetic test really does predict the future.

02

A strong risk gene, but not a sentence

The gene raises risk several times over, yet some carriers never get ill. Examples: a faulty BRCA1 or BRCA2 gene, which normally protects cells from cancer, sharply raises the risk of breast and ovarian cancer (this is the fault that led Angelina Jolie to preventive surgery). The APOE4 version of a gene raises the risk of Alzheimer's disease, the most common cause of memory loss in old age. Familial hypercholesterolaemia means inherited, very high cholesterol from childhood, and with it a risk of an early heart attack.

03

Thousands of genes, each a tiny nudge

Most everyday traits and diseases: height, weight, type 2 diabetes, depression, intelligence. For height, 12,111 genetic variants have been found; weight predictions are built from 2.1 million. No single variant decides anything here, and this is where lifestyle has the most room.

How heritable different traits are

This is not the chance of getting ill. The percentage shows how much of the difference between people is explained by differences in their genes rather than in their living conditions. Example: schizophrenia is 79% heritable, yet even the identical twin of a person with schizophrenia, with almost the same genes, develops it in only 33% of cases. The 79% means something else: across many people, why some get ill and others don't is mostly explained by genes. And the 33% for cancer means that most of the difference between people there is explained not by genes but by lifestyle, environment and chance. Data from twin and family studies.

Height, men (87–93% across eight countries)

90%

Autism

81%

Schizophrenia

79%

Weight relative to height (body mass index)

75%

ADHD (attention deficit disorder)

74%

General cognitive ability at 17

66%

Alcohol use disorder

49%

For comparison: the average across all human traits studied in twins (17,804, from height to habits)

49%

General cognitive ability at 9

41%

Personality traits

40%

Depression

37%

Cancer overall

33%

Sources: height, Silventoinen et al., 2003; autism, Bai et al., 2019; schizophrenia, Hilker et al., 2018; body mass index, Elks et al., 2012; ADHD, Faraone and Larsson, 2019; cognitive ability, Haworth et al., 2010; alcohol use disorder, Verhulst et al., 2015; average, Polderman et al., 2015; personality, Vukasović and Bratko, 2015; depression, Sullivan et al., 2000; cancer, Mucci et al., 2016. Note the two bars for cognitive ability: the same trait, in the same studies, at 9 and at 17. Heritability is not a constant. Lifespan is left off on purpose: according to the largest pedigree study, its true heritability is well below 10%.

Inherited diseases: where genes really decide

Five examples, from “almost a sentence” to “a strong but not final risk”. Look at the second one: the disease is 100% genetic, and its consequences depend 100% on what the person eats.

An inherited brain disorder (Huntington's disease): the rare case where a gene almost decides

Bates et al., Nature Reviews Disease Primers, 2015

How it was tested
A review of everything known about the disease: genetics, mechanism, diagnosis, treatment.
What came out
The disease is caused by an expanded repeat of three DNA “letters” (CAG) in the HTT gene. Inheritance is dominant: one changed copy from one parent is enough. So each child of a carrier has a 50% chance of inheriting the changed gene, and the chance is separate for every child, like a coin toss. The disease usually begins in the prime of adult life, progresses gradually and affects movement, thinking and behaviour. At the time of the review there were no drugs that changed its course.
What it means
Diseases like this created the idea of a “genetic sentence”. But they are rare, and their logic can't be carried over to heart attacks or diabetes. A limit: even here there is variation, because the length of the repeat affects when and how the disease appears.

What Huntington's disease does to the brain
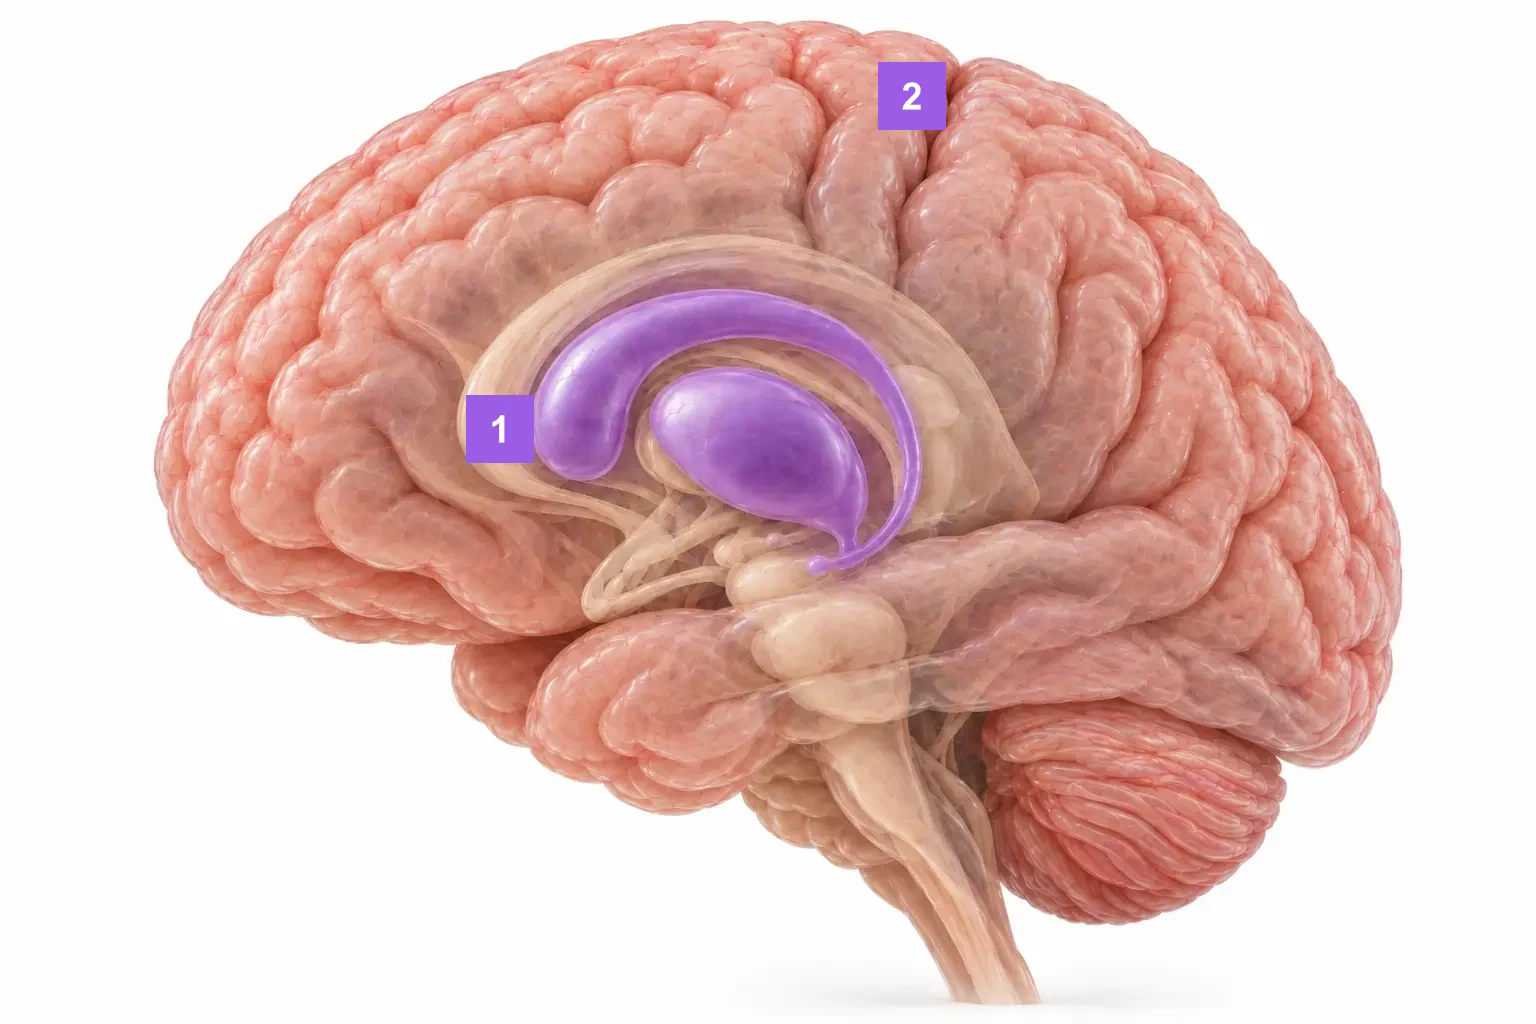
A semi-transparent brain seen from the side. Deep inside, slightly toward the front, the striatum is highlighted in purple: the arc of the caudate nucleus and the oval of the putamen.
  1. 1

    The striatum, highlighted in purple. A deep region that controls movement. The first changes appear here: already at the earliest stage visible under a microscope, about half of the nerve cells in the caudate nucleus are lost, and up to 95% at the late stage. Hence the involuntary jerking movements and clumsiness.

  2. 2

    The cortex, the folded outer layer of the brain. It thins too, and early, most of all in the strip that controls movement and sensation. Which parts of the cortex are affected differs from person to person, and this explains why symptoms vary so much: in some people movement problems dominate, in others problems with thinking or mood.
Schematic illustration. Anatomy checked against the BodyParts3D model (Life Science Databases, CC BY-SA 2.1 JP).
Read the study →

An inherited metabolic disorder (phenylketonuria) whose effects diet almost entirely prevents

Blau, van Spronsen and Levy, The Lancet, 2010

How it was tested
A review in The Lancet of the most common inherited disorder of amino acid metabolism.
What came out
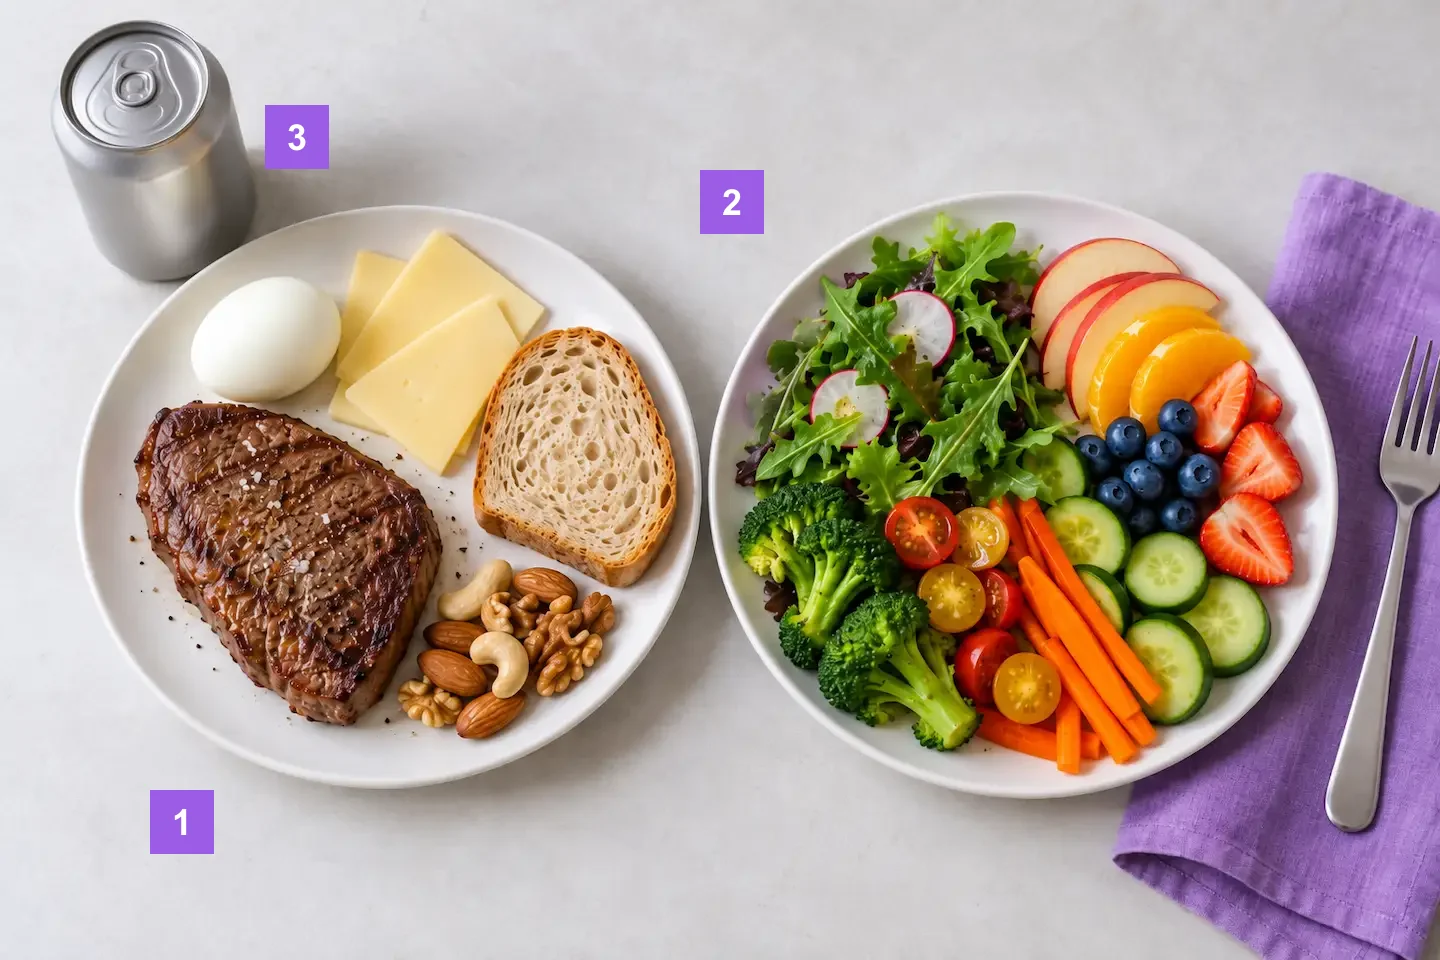
Phenylalanine is one of the amino acids, the “building blocks” that proteins are made of, and it is in almost every protein-rich food. Because of a faulty gene, the body of a person with the disease can't break it down, phenylalanine builds up in the blood, and without treatment the severe form leads to profound and irreversible intellectual disability. That is why newborns get a heel-prick blood test in their first days of life. If the disease is found, a diet with minimal phenylalanine starts straight away, and it prevents most of the damage to the brain. In practice, that means food with almost no ordinary protein, as in the picture below.
What it means
The best answer to “if it's genetic, nothing can be done”. Here the gene fully determines the disease, and the environment, meaning food, determines its consequences. A limit: the diet is hard, and, as the authors note, especially hard to stick to for teenagers, young adults and pregnant women.

The plate of a person with phenylketonuria: what's out and what's in

Two plates. On the left, a steak, a boiled egg, cheese, ordinary bread and nuts, with a can of soda beside them. On the right, salad, vegetables, berries and fruit.
  1. 1

    Off the menu, or only crumbs: meat, fish, eggs, cheese, milk, nuts, ordinary bread. All protein-rich food contains phenylalanine.

  2. 2

    The basis of the diet: vegetables, fruit, greens, plus special low-protein bread and pasta. Protein comes from a special medical formula without phenylalanine.

  3. 3

    Diet soda: the sweetener aspartame also contains phenylalanine, which is why such drinks carry a warning, “contains a source of phenylalanine” in the EU and “Phenylketonurics: contains phenylalanine” in the US.

Read the study →

An inherited tendency to breast and ovarian cancer (BRCA1 and BRCA2 genes): a very high risk, but not 100%

Kuchenbaecker et al., JAMA, 2017

How it was tested
BRCA1 and BRCA2 are genes that normally help a cell repair damaged DNA, and so protect against cancer. A fault in one of them runs in families and can come from either parent, and each child of a carrier has a 50% chance of inheriting it. The researchers followed 6,036 women carrying a BRCA1 fault and 3,820 carrying a BRCA2 fault in the UK, the Netherlands, France and other countries. 94% of participants came through family cancer clinics.
What came out
Cumulative breast cancer risk by age 80: 72% for BRCA1 and 69% for BRCA2. Ovarian cancer risk: 44% and 17%. The more close relatives had breast cancer, the higher the risk: with two or more, it was almost twice as high as with none.
What it means
This is one of the strongest known genetic risks, and it is exactly for these carriers that special screening and prevention programmes exist. But even here it is not a sentence: roughly one carrier in three or four will not have breast cancer by 80. A limit: participants mostly came from families where cancer had already occurred, so the risk for carriers without such a history may differ.

With an inherited BRCA1 or BRCA2 fault, about 7 women in 10 develop breast cancer by age 80

Faulty BRCA1 geneFaulty BRCA2 gene

Risk of breast cancer by age 80

72%
69%

Risk of ovarian cancer by age 80

44%
17%

Kuchenbaecker et al., JAMA, 2017. For comparison: the average lifetime risk of breast cancer among US women has been estimated at about 1 in 8, around 12% (Feuer et al., 1993). The comparison is rough: that estimate uses data from the late 1980s and covers the whole lifetime, not just up to age 80.

Read the study →

An inherited tendency to Alzheimer's disease (the APOE4 gene): in the worst case over 50%, but not 100%

Genin et al., Molecular Psychiatry, 2011

How it was tested
APOE is the gene for a protein that carries fats and cholesterol, including in the brain. Everyone has two copies, one from each parent, and one version of it, APOE4, raises the risk of Alzheimer's disease, the most common cause of dementia, meaning lasting loss of memory and thinking in old age. The study compared 7,351 people with Alzheimer's disease and 10,132 without, all of European ancestry. Lifetime risk was calculated from incidence data in the US and France.
What came out
By age 85, Alzheimer's disease develops in 11% of men and 14% of women overall. In people who inherited APOE4 from both parents: 51% of men and 60% of women. With APOE4 from one parent: 23–30%.
What it means
Two copies of APOE4 carry a risk comparable to BRCA1 for breast cancer. Yet even with them, 40–49% of people don't develop the disease by 85, and with one copy most don't. A limit: this is a calculation based on comparing patients with healthy people, not direct follow-up of carriers. How dementia risk changes with lifestyle is covered further on.

The risk of Alzheimer's disease by 85 rises with each copy of the APOE4 risk gene, but even with two it doesn't reach 100%

MenWomen

Average across everyone

11%
14%

One copy of the APOE4 risk gene (from mother or father)

23%
30%

Two copies of the APOE4 risk gene (from both parents)

51%
60%

Genin et al., Molecular Psychiatry, 2011, calculated from US incidence data. Risk rises with each copy of the gene, but even in the worst case the bar doesn't reach the end of the scale: 40–49% of people don't develop the disease by 85.

Read the study →

Inherited high cholesterol (familial hypercholesterolaemia): affects 1 person in 313 and raises the risk of an early heart attack

Beheshti et al., Journal of the American College of Cardiology, 2020

How it was tested
In this condition, a fault in a single gene means the liver struggles to clear “bad” cholesterol, and its level is very high from childhood. The researchers did a systematic review and meta-analysis of 104 studies covering more than 11 million people.
What came out
The condition affects 1 in 313 people overall, 1 in 31 people with coronary heart disease (narrowing of the heart's arteries, which leads to heart attacks), 1 in 15 of those in whom it started early, and 1 in 14 people with very high cholesterol. The prevalence came out the same whether the diagnosis was genetic or clinical (based on cholesterol levels and family history).
What it means
This is an inherited condition that shows up in an ordinary blood test. If there were early heart attacks in your family and your cholesterol is very high, it's a reason to ask your doctor about this diagnosis specifically. A limit: prevalence is known for only 17 of 195 countries.

The higher the cholesterol and the earlier the heart disease, the more likely the cause is inherited

Everyone (1 in 313)

0.3%

People with coronary heart disease (1 in 31)

3.2%

Coronary heart disease that started at a young age (1 in 15)

6.7%

Very high “bad” cholesterol, 190 mg/dL (4.9 mmol/L) or more (1 in 14)

7.2%

Beheshti et al., JACC, 2020. The threshold in the study: LDL (“bad”) cholesterol of 190 mg/dL or more, which is about 4.9 mmol/L. Among people with cholesterol this high, an inherited cause is 23 times more common than among everyone.

Read the study →

Cancer: how much is really “in the genes”

When someone in the family has had cancer, the first question is always the same: am I next? The most honest answers come from Scandinavian twin registries, which follow people for decades.

A 2000 study in NEJM analysed 44,788 twin pairs from Sweden, Denmark and Finland. A statistically significant heritable contribution was found for only three cancers: prostate (42%), colorectal (35%) and breast (27%). The authors put their conclusion plainly: for most types of cancer, inherited genes make a minor contribution, and the environment plays the principal role, meaning everything that isn't genes: smoking, diet, harmful exposures, age and chance.

An updated 2016 study covered 203,691 twins from four countries, followed for a median of 32 years. The heritability of cancer overall came out at 33%; it was highest for melanoma (58%) and prostate cancer (57%). But the most telling result is in pairs where one twin had already developed cancer.

The risk of getting cancer when a twin already has it

Average across all participants

32%

Non-identical twin of a person with cancer (half the genes shared)

37%

Identical twin of a person with cancer (almost the same genes)

46%

Mucci et al., JAMA, 2016. Even a person with almost the same genes as someone with cancer was more likely not to get it than to get it. And among identical pairs where both twins had cancer, only 38% had the same type.

What this means in practice: for most people, a family history of cancer shifts the risk but doesn't decide it. Smoking, alcohol, weight, sun and screening matter just as much.

It's different when several close relatives have had the same cancer, especially breast or ovarian. Then a strong gene such as BRCA may be involved, and that's a reason to see a clinical geneticist.

Weight: genes decide how much you gain, not whether you gain

Weight is one of the most heritable traits. The clearest evidence comes from identical twins separated in childhood and raised by different families. In a 1990 study, the body mass index of such twins matched almost as closely as in twins raised together: a correlation of 0.70 in men and 0.66 in women. The shared childhood environment had almost no effect on adult weight.

A review of 88 estimates from twin studies found heritability ranging from 47% to 90%, most often around 75%. Family studies give noticeably lower figures.

Now an experiment that shows what exactly is inherited. In a study in the same issue of NEJM, 12 pairs of young identical male twins ate 1,000 kcal a day more than they needed for 84 days, 84,000 extra kilocalories each in total.

The same 84,000 extra kilocalories, different results

Gained the least

4.3 kg

Average

8.1 kg

Gained the most

13.3 kg

Bouchard et al., NEJM, 1990. Within each pair, the brothers gained similarly: there was about three times more variation between pairs than within them.

What it means

Genes decided how much each man gained and where the fat went. But not whether he gained: all 24 participants put on at least 4.3 kg.

Individual weight genes exist, and their effect is modest. The best known is called FTO; it was discovered in 2007. 16% of adults carry two copies of the risk variant, and they weigh on average only about 3 kg more than those with none.

A combined prediction based on 2.1 million DNA variants separates people more strongly: between the 10% with the highest and the 10% with the lowest genetic score, the difference is 13 kg, and the risk of severe obesity differs 25-fold. But at birth, children with different scores weigh almost the same. The gap appears in early childhood and reaches 12 kg by age 18. In other words, genes play out in a particular environment, with particular food, rather than acting on their own.

Same genes, different lives: the Pima

The Pima Indians of Arizona have one of the highest rates of type 2 diabetes in the world. Part of the same people live in the Sierra Madre mountains of Mexico, and the two groups are genetically close. Researchers compared them directly.

Pima in Arizona, US

38.0%

Pima in the mountains of Mexico

6.9%

Non-Pima Mexicans from the same region

2.6%

Schulz et al., Diabetes Care, 2006. Obesity among the Mexican Pima was found in 7% of men and 20% of women, similar to their non-Pima neighbours and far less than in Arizona. Physical activity was much higher in both Mexican groups. The authors conclude that even in genetically prone populations, diabetes is determined mostly by living conditions and is largely preventable. A limit: this is a one-off comparison, and the groups differ not only in activity but in diet, work and many other conditions.

Can you “beat” your genes? Four tests

The most practical question in this explainer. Researchers took people at high genetic risk and looked at whether their lifestyle changed anything. Three studies are observational, one is randomised.

Exercise weakens the “obesity gene” FTO by a quarter

Kilpeläinen et al., PLoS Medicine, 2011

How it was tested
A meta-analysis of 45 studies of adults (218,166 people) and 9 studies of children and teenagers (19,268). Participants were split into physically active and inactive.
What came out
In inactive adults, each copy of the FTO risk variant raised the odds of obesity 1.30-fold; in active adults, 1.22-fold. Physical activity weakened the gene's effect by 27%. No such effect was found in children and teenagers.
What it means
The gene didn't disappear, but it got weaker. A limit: this is observational, not an experiment, and activity was crudely split into “yes” or “no”. The absence of an effect in children matters too: the finding can't be carried over to them.
Read the study →

Heart: a healthy lifestyle almost halves the risk even with bad genes

Khera et al., New England Journal of Medicine, 2016

How it was tested
55,685 participants in four studies in the US and Sweden. Genetic risk of coronary heart disease (narrowing of the heart's arteries, which leads to heart attacks) was estimated with a polygenic score, a combined estimate from many DNA variants; lifestyle with four points: not smoking, no obesity, regular exercise, a healthy diet.
What came out
People in the top 20% of genetic risk had coronary events (heart attacks and other serious problems with the heart's arteries) 91% more often than people in the bottom 20%. But among people at high genetic risk, a favourable lifestyle (three or four points out of four) was linked to a 46% lower risk than an unfavourable one (none or one). In one of the studies, the 10-year rate of coronary events in this group fell from 10.7% to 5.1%.
What it means
Genetic risk and lifestyle acted independently: healthy habits helped in every genetic group. A limit: this is observational. People who don't smoke and do exercise differ in other ways too, so not all of the difference can be credited to the habits themselves.
Read the study →

Dementia: high genetic risk plus healthy habits

Lourida et al., JAMA, 2019

How it was tested
196,383 people aged 60 or older without dementia at the start, from the UK Biobank, followed for 8 years on average. Genetic risk from a polygenic score, lifestyle from smoking, activity, diet and alcohol.
What came out
Dementia developed in 1.23% of people at high genetic risk and 0.63% of those at low risk. Among people at high genetic risk: 1.13% with a favourable lifestyle versus 1.78% with an unfavourable one, a 32% lower risk.
What it means
Even with bad genes, habits made a difference. A limit: the absolute numbers are small, 8 years is short for dementia, diagnoses came only from hospital records and death certificates, and participants were all of European ancestry. And again, this is observational, not an experiment.
Read the study →

Diabetes: in a randomised trial, lifestyle change worked for carriers of the risk gene too

Florez et al., New England Journal of Medicine, 2006

How it was tested
3,548 people with impaired glucose tolerance (a pre-diabetic state) in the randomised Diabetes Prevention Program: lifestyle change, metformin (a diabetes drug) or placebo. The researchers checked the TCF7L2 gene variant most strongly linked to diabetes: in its carriers, the pancreas produces less insulin.
What came out
Over three years, people with two risk copies of the gene progressed to diabetes more often than people with two ordinary copies. In the placebo group the risk was 1.81 times higher, in the metformin group 1.62 times, and in the lifestyle group only 1.15 times.
What it means
Here the interventions were assigned at random, so the evidence is stronger than in observational studies. A limit: the formal test found no significant difference between groups, so it can't be claimed that lifestyle “cancels out” the gene. What can be said is this: lifestyle change worked for carriers of the risk genotype too.
Read the study →

Height and physical ability: 90% heritable, yet 20 centimetres taller

Height is the classic example of a highly heritable trait. In a study of 30,111 twin pairs from eight countries, the heritability of height came out at 87–93% in men and 68–84% in women (up to 89–93% depending on the model). Yet average height varied between countries: from 177 cm for men and 163 cm for women in Italy to 184 cm and 171 cm in the Netherlands.

Now look across a century. An analysis of measurements from 18.6 million people in 200 countries, born between 1896 and 1996, showed that some nations quite literally grew.

How much taller people became in a century

Women in South Korea

20.2 cm

Men in Iran

16.5 cm

NCD Risk Factor Collaboration, eLife, 2016. The largest gains in height over the century, among women and among men worldwide.

The tallest people of the century were men born in the Netherlands in the last quarter of the 20th century: over 182.5 cm on average. Meanwhile, in parts of sub-Saharan Africa and South Asia, height barely changed in a hundred years. Genes don't change like that in three or four generations. So heritability explains why people living in the same conditions differ from each other, while the average is set by conditions: food, childhood illness, medicine.

Nearly all the common genetic variants that affect height have now been found, at least for people of European ancestry. A study of 5.4 million people found 12,111 variants that together explain 40% of the differences in height among people of European ancestry, but only 10–20% in other populations. In other words, “genetic predictions” are mostly built on European data and work noticeably worse for the rest of the world. The same applies to polygenic scores in general.

Athletic ability is a similar story. A real “speed gene” exists: because of a common variant of the ACTN3 gene, about 18% of healthy people of European ancestry have no alpha-actinin-3 protein in their fast muscle fibres at all, and it causes no disease. Among elite sprinters, the working version of the gene is noticeably more common than in the general population.

But the study compared already selected champions with a control group. It didn't test whether this gene can predict which children will become athletes, and that is exactly what “sports gene” tests promise.

Intelligence: the most uncomfortable topic

Intelligence is clearly heritable, and it becomes more so with age. That's what a study of 11,000 twin pairs from four countries showed.

Heritability of general cognitive ability by age

At 9

41%

At 12

55%

At 17

66%

Haworth et al., Molecular Psychiatry, 2010. A review in Molecular Psychiatry puts it at about 20% in infancy, rising to perhaps 80% in later adulthood.

This runs against intuition: you'd expect experience to pile up over the years and the role of the environment to grow. The authors offer an explanation: the older a child gets, the more they choose and create their own environment according to their inclinations. Genes act partly through which books, friends and pastimes a person seeks out.

The most interesting finding here is how heritability depends on conditions. In a study of seven-year-old twins in the US, where many families lived near the poverty line, the shared environment explained 60% of the differences in IQ in poor families, while the contribution of genes was close to zero. In affluent families it was the reverse.

A 2016 meta-analysis tested this across many studies. In the US, the effect held up. But in Western Europe and Australia, where, as the authors put it, social policies ensure more equal access to education and health care, it was zero or even reversed.

An unexpected conclusion

The heritability of intelligence partly measures how equal conditions are. When a child lacks the basics, the environment decides. When everyone has the basics, the differences that remain are more genetic.

Can ability be predicted from DNA? Not well, so far. The largest study, of 3 million people, found 3,952 variants linked to educational attainment, and the combined genetic score explains only 12–16% of the differences. More than 80% remain unexplained.

What's more, only about half of that link is direct. The rest, as geneticists themselves explain, comes from the family: parents with certain variants create a certain environment for their children, and people choose partners similar to themselves. A comparison of 178,086 siblings confirmed it: within the same family, the genetic effects on education, cognitive ability and even height come out smaller than when comparing unrelated people.

Mental health: a large genetic contribution, and no “depression gene”

Mental disorders are among the most heritable conditions in medicine. But this is also where myths about single genes “for” something are most common.

Schizophrenia: 79% heritable, yet only a third of identical twins both develop it

Hilker et al., Biological Psychiatry, 2018

How it was tested
31,524 twin pairs born in Denmark between 1951 and 2000; data from two national registers.
What came out
Heritability of schizophrenia was 79%, and 73% for the broader spectrum of disorders. But when one identical twin was ill, the other had the same diagnosis in only 33% of cases; among non-identical twins, 7%.
What it means
Both numbers are true at once, and that is the key point. High heritability doesn't mean that a genetically identical person will inevitably get ill. The authors state plainly that the low concordance in identical twins shows that vulnerability isn't determined by genes alone.
Read the study →

Depression: 37% genes, 63% individual experience

Sullivan, Neale and Kendler, American Journal of Psychiatry, 2000

How it was tested
A meta-analysis of family and twin studies of major depression.
What came out
First-degree relatives of people with depression had 2.84 times higher odds of it. Heritability across five twin studies was 37%, the contribution of the shared family environment was close to zero, and 63% came down to each person's individual experience (together with measurement error).
What it means
Depression really does run in families, mostly through genes rather than shared upbringing. But most of the differences come from what happens to a particular person. A limit: the study is old and small by today's standards, although the authors stress that the results were consistent across samples and methods.
Read the study →

Autism: about 80% heritable across five countries

Bai et al., JAMA Psychiatry, 2019

How it was tested
2,001,631 children from Denmark, Finland, Sweden, Israel and Western Australia, born between 1998 and 2011 and followed up to age 16; 22,156 were diagnosed with autism spectrum disorder.
What came out
Median heritability was 80.8%, from 50.9% in Finland to 86.8% in Israel. Maternal effects (pregnancy, birth) contributed only 0.4–1.6%.
What it means
Autism is mostly genetic, which is one reason why searching for a “culprit” in the environment so often leads nowhere. How the best-known myth about the cause of autism was tested is covered in our explainer on vaccination. A limit: estimates differ noticeably between countries, and the authors allow that sources of risk may differ somewhat from country to country.
Read the study →

“Depression genes”: the 18 best-known candidates didn't hold up

Border et al., American Journal of Psychiatry, 2019

How it was tested
The researchers took 18 candidate genes, each studied at least 10 times, and tested them in samples of 62,138 to 443,264 people following a pre-registered plan.
What came out
No variant was clearly linked to depression, either on its own or in combination with childhood trauma or poverty. As a group, these genes were no more linked to depression than random genes.
What it means
The authors say it directly: the early hypotheses were wrong, and the large number of published associations are most likely false positives from small studies. The heritability of depression is real, but it is spread across thousands of variants with tiny effects. The same goes for ADHD: according to a review of its genetics, it is 74% heritable, but each individual variant has a very small effect.
Read the study →

Personality, addiction and longevity

Personality traits are moderately heritable. A meta-analysis of 62 estimates covering more than 100,000 people found a heritability of 40%, with the remaining 60% down to the environment. An honest detail from the same study: twin studies give 47% on average, while family and adoption studies give only 22%. The method of calculation shifts the answer by itself, and that applies to almost every number in this explainer.

Alcohol use disorder is about 50% heritable: that's the result of a meta-analysis of 12 twin studies and 5 adoption studies, and it was the same for men and women. Another 10% comes from the shared family environment. So a child from a family where people drank heavily really is at risk and should know it. But half of the differences have nothing to do with genes.

Longevity, though, which we most often think of as running in families, turned out to be barely genetic at all. A study of the family trees of hundreds of millions of people from Ancestry first produced the usual heritability estimate of 15–30%.

But then the researchers compared in-laws, people with no genes in common, such as a sister's husband. Their lifespans turned out to match almost as closely as those of blood relatives. The reason is that people choose partners with a similar lifestyle, income and habits. Adjusted for this, the true heritability of lifespan came out well below 10%.

So “everyone in our family lived to ninety” says more about how your family lived than about its DNA.

Six myths about genes

Myth

“My mother had diabetes, so I will too”

In reality

Genetically close Pima Indians have diabetes at a rate of 38% in Arizona and 6.9% in the mountains of Mexico. And in a randomised trial, lifestyle change worked for carriers of the riskiest gene variant too.

Myth

“80% heritable means 80% caused by genes”

In reality

Heritability describes differences between people in a group, not an individual. Height in men is 87–93% heritable, yet South Korean women grew 20 cm in a century.

Myth

“There's a gene for depression, a gene for intelligence, a gene for obesity”

In reality

The 18 best-known “depression genes” didn't hold up in hundreds of thousands of people. The strongest known weight gene, FTO, adds about 3 kg. A score built from 3,952 variants explains only 12–16% of differences in education.

Myth

“Longevity is in our genes: everyone in our family lived to ninety”

In reality

The true heritability of lifespan is well below 10%. In-laws with no shared genes live almost as similarly as blood relatives, because people choose partners with a similar lifestyle.

Myth

“If a disease is genetic, nothing can be done about it”

In reality

Phenylketonuria is entirely genetic, and a diet from the first days of life prevents most of its consequences. Among people with the highest genetic risk of heart disease, a healthy lifestyle was linked to a 46% lower risk.

Myth

“Epigenetics means you can rewrite your genes with thoughts and habits”

In reality

The environment really does leave marks on DNA: people conceived during the Dutch famine of 1944–1945 had, six decades later, different chemical marks on the IGF2 gene, which affects growth, than their siblings. But that's the mark of famine in the first weeks of development, not of positive thinking. The sequence of the genes doesn't change.

Genetic testing: when it's genuinely useful

Home DNA tests promise to tell you about disease risks, your ideal diet and your athletic potential. Accuracy is a problem. A US clinical laboratory checked 49 samples that people sent in for confirmation after such a test: 40% of the variants found in the raw data of consumer tests turned out to be false positives. Some variants labelled “increased risk” were classed as harmless and common by clinical laboratories.

A limit: the sample is small and made up of people who chose to get checked, so the overall error rate can't be calculated from it. But the scale of the problem is clear.

Polygenic predictions have a different limitation: they honestly report a shift in the odds, but that shift usually doesn't change what you should do. A person with a high genetic risk of heart disease or dementia gets the same advice as everyone else: don't smoke, stay active, watch your weight and blood pressure. The difference is that for them the advice matters even more.

Heart attacks over 10 years in people with the worst genetic risk

Unhealthy lifestyle (0–1 of 4 healthy habits)

10.7%

Healthy lifestyle (3–4 of 4 habits)

5.1%

Khera et al., NEJM, 2016, one of the four studies in the paper (US). Habits: not smoking, no obesity, regular exercise, a healthy diet. A limit: this is observational, and people with healthy habits differ in other ways too.

A medical genetic test, ordered by a clinical geneticist, makes sense in three situations:

01

Several relatives had breast or ovarian cancer

A BRCA1 or BRCA2 fault is possible. With each affected relative, the risk for a carrier rises.

02

Early heart attacks in the family and very high cholesterol

Familial hypercholesterolaemia, inherited high cholesterol, is possible. Among people with very high cholesterol it is found in 1 in 14.

03

A specific mutation has already been found in the family

Then the test looks for exactly that mutation and answers a specific question: did you inherit it or not.

In these cases the result changes the plan for monitoring, prevention or treatment. A test “out of curiosity” mostly changes nothing except your anxiety level.

Glossary: eight words that help you read news about genes

Heritability
The share of differences between people in a particular group that is linked to differences in their genes. It describes a group, not an individual, and changes with conditions.
Monogenic disease
A disease caused by a change in a single gene: Huntington's disease, phenylketonuria, familial hypercholesterolaemia. Mostly rare, although familial hypercholesterolaemia affects 1 in 313 people.
Penetrance
The share of carriers of a genetic variant who actually develop the disease. For BRCA1 and breast cancer by age 80, about 72%, so not 100%.
Polygenic score
A combined risk estimate from thousands or millions of DNA variants, each with a tiny effect. It shifts the odds but rarely predicts anything for a specific person.
GWAS
Genome-wide association study: millions of points in the DNA of hundreds of thousands of people are compared to find variants linked to a trait.
Identical and non-identical twins
Identical twins share almost all their genes, non-identical twins about half on average, like ordinary siblings. Comparing the two underlies most heritability estimates.
Assortative mating
The tendency to choose a partner similar to yourself in education, habits or height. Because of it, relatives are alike in more than their genes, and heritability estimates can be inflated.
Epigenetics
Chemical marks on DNA that switch genes on or off without changing their sequence. The environment really can change them, but it is not a way to “rewrite” your genes.

Frequently asked questions

Is cancer hereditary?

Partly. The heritability of cancer overall is about 33%, and for most tumour types the environment plays the principal role. Even the identical twin of a person with cancer had a risk of 46%, against 32% on average. The exception is strong genes such as BRCA1 and BRCA2, with which the risk of breast cancer by age 80 reaches 69–72%.

Can you lose weight if obesity is in your genes?

Yes. Genes affect how much a person gains from the same food surplus: in an experiment with twins the range was 4.3 to 13.3 kg, but everyone gained. Physical activity weakens the effect of the FTO gene by 27%, and genetically close groups living in different conditions have very different rates of obesity and diabetes.

Is intelligence inherited?

Largely, yes: the heritability of cognitive ability rises from 41% at age 9 to 66% at 17. But it depends on conditions: in poor families in the US, the contribution of genes was close to zero. And predicting a particular child's ability from DNA isn't possible yet: the best genetic score explains 12–16% of differences in education.

Is depression hereditary?

Partly: the heritability of depression is about 37%, and close relatives have roughly three times higher odds of it. But there is no single “depression gene”: the 18 best-known candidates didn't hold up in hundreds of thousands of people.

Should I take a DNA test for disease risk?

A consumer test out of curiosity, mostly no: when a clinical laboratory checked them, 40% of the variants found by such tests turned out to be false positives. A medical test through a clinical geneticist makes sense if there are several cases of breast or ovarian cancer in the family, early heart attacks with very high cholesterol, or a mutation already known in the family.

Is longevity inherited?

Much less than it seems. Once you account for people choosing partners with a similar lifestyle, the true heritability of lifespan is well below 10%.

Our Conclusion

Genes influence almost everything, but mostly not the way family stories suggest. A true “genetic sentence”, like Huntington's disease, is rare. And even phenylketonuria, which is entirely genetic, is almost completely switched off by diet. Strong risk genes such as BRCA or APOE4 make a disease very likely but not inevitable, and it is for them that a medical genetic test makes sense. For everything else, from weight and diabetes to heart attacks, depression and intelligence, genes work as thousands of tiny nudges. They decide how easily you put on weight or how closely you should watch your blood pressure. But they don't decide whether it happens: the same genes produce 38% diabetes in Arizona and 6.9% in the mountains of Mexico, and healthy habits almost halve the risk of heart disease even in people with the worst genetic outlook. So the most useful way to think about your family history is this: it's not a forecast, it's a hint about what to pay attention to. If one disease shows up many times in your family, especially breast or ovarian cancer or early heart attacks, it's worth talking to a doctor about screening. In every other case, the advice is the same as for everyone else; it just matters a little more for you.

Sources

Every claim in the text rests on a primary publication checked through PubMed. Links go to the publisher's site.

  1. Polderman TJ, Benyamin B, de Leeuw CA, et al. Meta-analysis of the heritability of human traits based on fifty years of twin studies. Nature Genetics, 2015;47(7):702–9.
  2. Visscher PM, Hill WG, Wray NR. Heritability in the genomics era: concepts and misconceptions. Nature Reviews Genetics, 2008;9(4):255–66.
  3. Bates GP, Dorsey R, Gusella JF, et al. Huntington disease. Nature Reviews Disease Primers, 2015;1:15005.
  4. Vonsattel JP, Myers RH, Stevens TJ, et al. Neuropathological classification of Huntington's disease. Journal of Neuropathology and Experimental Neurology, 1985;44(6):559–77.
  5. Rosas HD, Liu AK, Hersch S, et al. Regional and progressive thinning of the cortical ribbon in Huntington's disease. Neurology, 2002;58(5):695–701.
  6. Rosas HD, Salat DH, Lee SY, et al. Cerebral cortex and the clinical expression of Huntington's disease: complexity and heterogeneity. Brain, 2008;131(Pt 4):1057–68.
  7. Blau N, van Spronsen FJ, Levy HL. Phenylketonuria. The Lancet, 2010;376(9750):1417–27.
  8. Kuchenbaecker KB, Hopper JL, Barnes DR, et al. Risks of Breast, Ovarian, and Contralateral Breast Cancer for BRCA1 and BRCA2 Mutation Carriers. JAMA, 2017;317(23):2402–2416.
  9. Feuer EJ, Wun LM, Boring CC, et al. The lifetime risk of developing breast cancer. Journal of the National Cancer Institute, 1993;85(11):892–7.
  10. Genin E, Hannequin D, Wallon D, et al. APOE and Alzheimer disease: a major gene with semi-dominant inheritance. Molecular Psychiatry, 2011;16(9):903–7.
  11. Beheshti SO, Madsen CM, Varbo A, et al. Worldwide Prevalence of Familial Hypercholesterolemia: Meta-Analyses of 11 Million Subjects. Journal of the American College of Cardiology, 2020;75(20):2553–2566.
  12. Lichtenstein P, Holm NV, Verkasalo PK, et al. Environmental and heritable factors in the causation of cancer: analyses of cohorts of twins from Sweden, Denmark, and Finland. New England Journal of Medicine, 2000;343(2):78–85.
  13. Mucci LA, Hjelmborg JB, Harris JR, et al. Familial Risk and Heritability of Cancer Among Twins in Nordic Countries. JAMA, 2016;315(1):68–76.
  14. Stunkard AJ, Harris JR, Pedersen NL, McClearn GE. The body-mass index of twins who have been reared apart. New England Journal of Medicine, 1990;322(21):1483–7.
  15. Elks CE, den Hoed M, Zhao JH, et al. Variability in the heritability of body mass index: a systematic review and meta-regression. Frontiers in Endocrinology, 2012;3:29.
  16. Bouchard C, Tremblay A, Després JP, et al. The response to long-term overfeeding in identical twins. New England Journal of Medicine, 1990;322(21):1477–82.
  17. Frayling TM, Timpson NJ, Weedon MN, et al. A common variant in the FTO gene is associated with body mass index and predisposes to childhood and adult obesity. Science, 2007;316(5826):889–94.
  18. Khera AV, Chaffin M, Wade KH, et al. Polygenic Prediction of Weight and Obesity Trajectories from Birth to Adulthood. Cell, 2019;177(3):587–596.
  19. Schulz LO, Bennett PH, Ravussin E, et al. Effects of traditional and western environments on prevalence of type 2 diabetes in Pima Indians in Mexico and the U.S. Diabetes Care, 2006;29(8):1866–71.
  20. Kilpeläinen TO, Qi L, Brage S, et al. Physical activity attenuates the influence of FTO variants on obesity risk: a meta-analysis of 218,166 adults and 19,268 children. PLoS Medicine, 2011;8(11):e1001116.
  21. Khera AV, Emdin CA, Drake I, et al. Genetic Risk, Adherence to a Healthy Lifestyle, and Coronary Disease. New England Journal of Medicine, 2016;375(24):2349–2358.
  22. Lourida I, Hannon E, Littlejohns TJ, et al. Association of Lifestyle and Genetic Risk With Incidence of Dementia. JAMA, 2019;322(5):430–437.
  23. Florez JC, Jablonski KA, Bayley N, et al. TCF7L2 polymorphisms and progression to diabetes in the Diabetes Prevention Program. New England Journal of Medicine, 2006;355(3):241–50.
  24. Silventoinen K, Sammalisto S, Perola M, et al. Heritability of adult body height: a comparative study of twin cohorts in eight countries. Twin Research, 2003;6(5):399–408.
  25. NCD Risk Factor Collaboration (NCD-RisC). A century of trends in adult human height. eLife, 2016;5:e13410.
  26. Yengo L, Vedantam S, Marouli E, et al. A saturated map of common genetic variants associated with human height. Nature, 2022;610(7933):704–712.
  27. Martin AR, Kanai M, Kamatani Y, et al. Clinical use of current polygenic risk scores may exacerbate health disparities. Nature Genetics, 2019;51(4):584–591.
  28. Yang N, MacArthur DG, Gulbin JP, et al. ACTN3 genotype is associated with human elite athletic performance. American Journal of Human Genetics, 2003;73(3):627–31.
  29. Haworth CM, Wright MJ, Luciano M, et al. The heritability of general cognitive ability increases linearly from childhood to young adulthood. Molecular Psychiatry, 2010;15(11):1112–20.
  30. Plomin R, Deary IJ. Genetics and intelligence differences: five special findings. Molecular Psychiatry, 2015;20(1):98–108.
  31. Turkheimer E, Haley A, Waldron M, et al. Socioeconomic status modifies heritability of IQ in young children. Psychological Science, 2003;14(6):623–8.
  32. Tucker-Drob EM, Bates TC. Large Cross-National Differences in Gene × Socioeconomic Status Interaction on Intelligence. Psychological Science, 2016;27(2):138–149.
  33. Okbay A, Wu Y, Wang N, et al. Polygenic prediction of educational attainment within and between families from genome-wide association analyses in 3 million individuals. Nature Genetics, 2022;54(4):437–449.
  34. Howe LJ, Nivard MG, Morris TT, et al. Within-sibship genome-wide association analyses decrease bias in estimates of direct genetic effects. Nature Genetics, 2022;54(5):581–592.
  35. Hilker R, Helenius D, Fagerlund B, et al. Heritability of Schizophrenia and Schizophrenia Spectrum Based on the Nationwide Danish Twin Register. Biological Psychiatry, 2018;83(6):492–498.
  36. Sullivan PF, Neale MC, Kendler KS. Genetic epidemiology of major depression: review and meta-analysis. American Journal of Psychiatry, 2000;157(10):1552–62.
  37. Bai D, Yip BHK, Windham GC, et al. Association of Genetic and Environmental Factors With Autism in a 5-Country Cohort. JAMA Psychiatry, 2019;76(10):1035–1043.
  38. Border R, Johnson EC, Evans LM, et al. No Support for Historical Candidate Gene or Candidate Gene-by-Interaction Hypotheses for Major Depression Across Multiple Large Samples. American Journal of Psychiatry, 2019;176(5):376–387.
  39. Faraone SV, Larsson H. Genetics of attention deficit hyperactivity disorder. Molecular Psychiatry, 2019;24(4):562–575.
  40. Vukasović T, Bratko D. Heritability of personality: A meta-analysis of behavior genetic studies. Psychological Bulletin, 2015;141(4):769–85.
  41. Verhulst B, Neale MC, Kendler KS. The heritability of alcohol use disorders: a meta-analysis of twin and adoption studies. Psychological Medicine, 2015;45(5):1061–72.
  42. Ruby JG, Wright KM, Rand KA, et al. Estimates of the Heritability of Human Longevity Are Substantially Inflated due to Assortative Mating. Genetics, 2018;210(3):1109–1124.
  43. Heijmans BT, Tobi EW, Stein AD, et al. Persistent epigenetic differences associated with prenatal exposure to famine in humans. Proceedings of the National Academy of Sciences, 2008;105(44):17046–9.
  44. Tandy-Connor S, Guiltinan J, Krempely K, et al. False-positive results released by direct-to-consumer genetic tests highlight the importance of clinical confirmation testing for appropriate patient care. Genetics in Medicine, 2018;20(12):1515–1521.
Share:

This article is for informational purposes only and does not constitute medical advice. Every claim here rests on primary research linked in the Sources section — each one can be opened and checked. Any treatment decisions should be made together with your doctor.